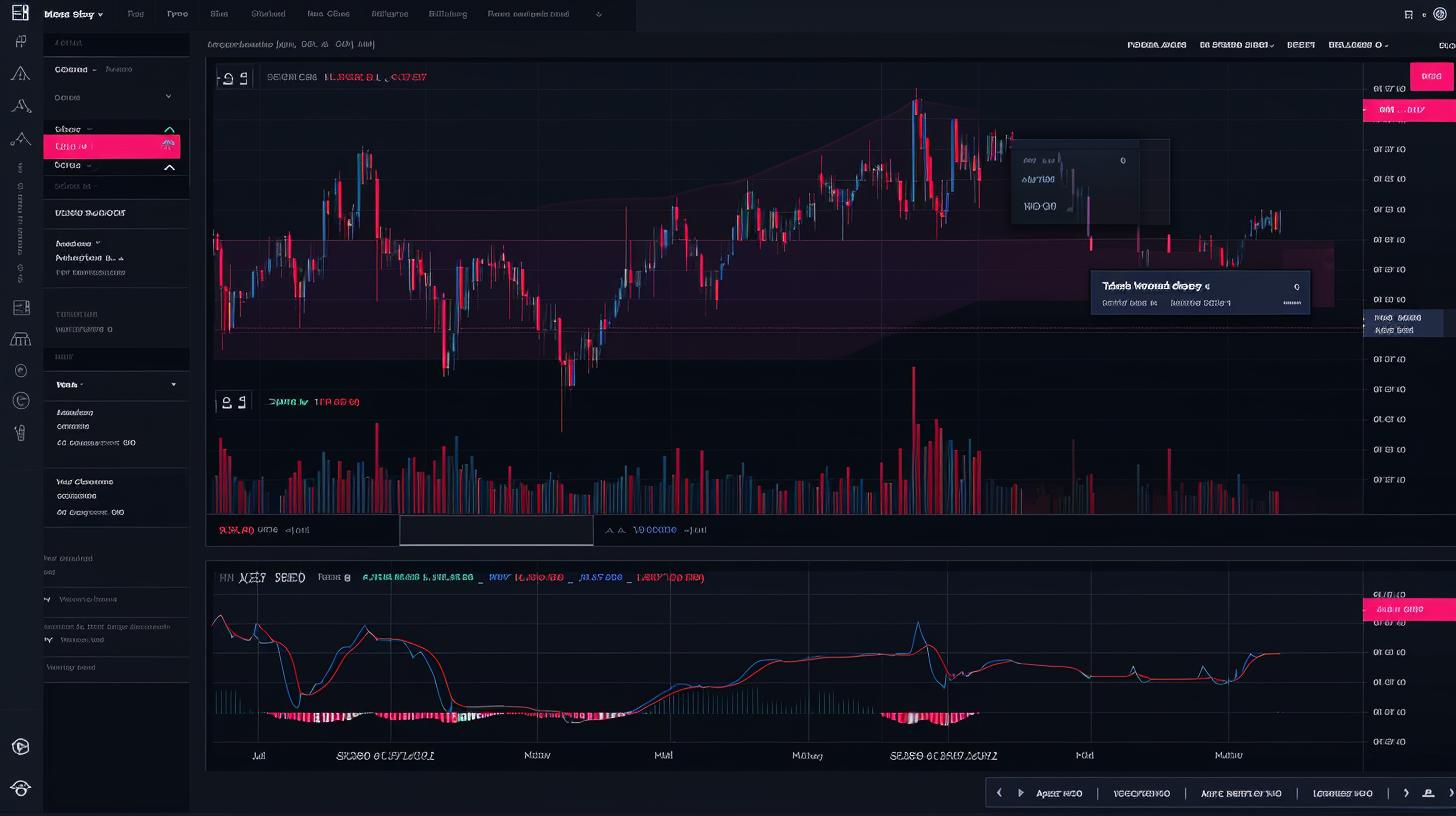
Are you looking for the best free indicators on TradingView for crypto trading? Utilizing indicators can be incredibly helpful when it comes to making informed decisions in the volatile world of cryptocurrency trading.
Whether you are a seasoned trader or just starting out, having access to the right indicators can make a significant difference in your success. In this article, we will explore the various free indicators available on TradingView and discuss their effectiveness in helping you navigate the complex world of crypto trading.
When it comes to analyzing market trends and making informed trading decisions, moving averages are among the most commonly used indicators. We will delve into the different types of moving averages that are available for free on TradingView and how they can be utilized to identify potential entry and exit points for cryptocurrency trades.
In addition to moving averages, Bollinger Bands, Relative Strength Index (RSI), MACD (Moving Average Convergence Divergence), Volume Profile, and Ichimoku Cloud are also powerful tools that traders can utilize to gain insights into market movements. Understanding how these indicators work and their relevance in the context of crypto trading is essential for developing a successful trading strategy. Throughout this article, we will analyze each indicator’s benefits and discuss their significance as free resources on TradingView.
Moving Averages
Simple Moving Average (SMA)
The simple moving average is a basic yet powerful tool that smooths out price data to create a single trend line. It helps traders identify the direction of the trend and potential support or resistance levels. As one of the best free indicators on TradingView for crypto, the SMA is widely used by traders to determine entry and exit points.
Exponential Moving Average (EMA)
The exponential moving average gives more weight to recent price data, making it more responsive to current market conditions compared to the SMA. This makes it particularly useful for short-term traders who want to react quickly to price movements. Traders can easily access EMA for free on TradingView and utilize it to spot trends and potential trading opportunities in the crypto market.
Weighted Moving Average (WMA)
The weighted moving average assigns more weight to the most recent prices, similar to EMA. However, unlike EMA, WMA places greater emphasis on the most recent data points while still considering historical data. Free on TradingView, WMA can be a valuable indicator for identifying trends and making well-informed trading decisions in the cryptocurrency market.
By understanding and utilizing different types of moving averages available for free on TradingView, crypto traders can gain valuable insights into market trends and potential entry or exit points. These indicators play a crucial role in formulating effective trading strategies and maximizing profits in the ever-changing world of cryptocurrency trading.
Bollinger Bands
When it comes to crypto trading on TradingView, Bollinger Bands are among the best free indicators available for traders. These bands consist of a simple moving average (SMA) and two standard deviations above and below the SMA. They are used to measure volatility and identify overbought or oversold conditions in the market.
How Bollinger Bands Work
Bollinger Bands work by creating a dynamic range around the price movement of a cryptocurrency. When the price touches the upper band, it may indicate that the asset is overbought, while touching the lower band may suggest that it’s oversold. Traders also look for periods of low volatility when the bands squeeze close together, which often precedes strong price movements in either direction.
Benefits of Using Bollinger Bands
One of the key benefits of using Bollinger Bands as a free indicator on TradingView for crypto trading is their ability to provide clear visual signals for potential buying or selling opportunities. Additionally, they can help traders set stop-loss orders and determine optimal entry and exit points based on market volatility.
Overall, Bollinger Bands are a versatile and effective tool for analyzing crypto market trends and making informed trading decisions. When used in conjunction with other free indicators on TradingView for crypto, such as Moving Averages or RSI, they can provide valuable insights into market behavior and enhance a trader’s overall strategy.
Relative Strength Index (RSI)
Relative Strength Index (RSI) is one of the best free indicators on TradingView for crypto trading. RSI is a momentum oscillator that measures the speed and change of price movements. This indicator oscillates between 0 and 100 and is typically used to identify overbought or oversold conditions in a market. Traders often use RSI to determine when an asset is overbought and likely to reverse or when it is oversold and likely to bounce back.
One of the main benefits of using RSI as a free indicator for crypto trading on TradingView is its ability to provide clear signals for potential trend reversals. When the RSI crosses above 70, it indicates that the asset may be overbought and due for a correction.
On the other hand, when it drops below 30, it signals that the asset may be oversold and could see a price increase in the near future. This information can be crucial for traders looking to enter or exit positions at optimal times.
Additionally, RSI can also be used to confirm the strength of a trend. When the RSI moves in the same direction as the price, it provides confirmation that the trend is strong. Conversely, if there is a divergence between the RSI and price movement, it can signal that a trend reversal may be imminent. By paying attention to these signals, traders can make more informed decisions when trading cryptocurrencies on TradingView.

MACD (Moving Average Convergence Divergence)
When it comes to crypto trading on TradingView, one of the best free indicators to use is the Moving Average Convergence Divergence (MACD). This indicator is widely popular among traders due to its effectiveness in identifying trend changes and potential buy or sell signals. The MACD consists of two lines – the MACD line and the signal line – as well as a histogram which represents the difference between the two lines.
Traders can utilize the MACD indicator to identify bullish and bearish crossovers, as well as divergences between the MACD line and the price action of a cryptocurrency. Additionally, the histogram can provide valuable insight into the strength of a trend and potential reversals. By incorporating the MACD into their technical analysis, traders can make more informed decisions when executing trades in the volatile crypto market.
| Key Aspect | Description |
|---|---|
| Identifying Trend Changes | MACD helps in identifying potential trend reversals in cryptocurrency prices. |
| Divergences | Traders can spot bullish or bearish divergences between price action and the MACD line. |
| Risk Management | It’s crucial to use MACD in conjunction with risk management strategies to mitigate potential losses. |
Volume Profile
- Session Volume – This indicator displays the volume profile for each trading session, allowing traders to identify areas of high and low trading activity throughout the day. By understanding where most of the trading volume is concentrated, traders can anticipate potential price movements and adjust their trading strategies accordingly.
- Visible Range – Visible Range is another essential Volume Profile indicator that allows traders to focus on a specific period or range of prices. This indicator helps traders analyze the distribution of volume within a selected timeframe, providing valuable information about price acceptance and rejection levels.
- Point Of Control (POC) – The Point Of Control indicator denotes the price level with the highest traded volume within a specified period. By identifying the POC, traders can gain insights into significant price levels where market participants are most active, enabling them to make more informed trading decisions.
Utilizing these Volume Profile indicators can significantly enhance a trader’s ability to identify potential entry and exit points in the cryptocurrency market. When combined with other technical analysis tools, such as moving averages and Bollinger Bands, Volume Profile can provide a comprehensive overview of market sentiment and help traders navigate the volatile crypto markets with greater confidence.

Ichimoku Cloud
The Ichimoku Cloud, also known as Ichimoku Kinko Hyo, is a versatile and comprehensive indicator that can provide valuable insights for crypto traders on TradingView. This free indicator consists of multiple components that work together to give a holistic view of the market trend, support and resistance levels, and potential price momentum.
The main components of the Ichimoku Cloud include the Kumo (cloud), Tenkan-sen (conversion line), Kijun-sen (base line), Chikou Span (lagging line), and Senkou Span A and B.
One of the key advantages of using the Ichimoku Cloud is its ability to visually represent different aspects of price action, making it easier for traders to identify potential trend reversals and breakouts. The Kumo, or cloud, serves as a dynamic support and resistance level, providing traders with important reference points for determining entry and exit points.
Additionally, the intersection of the conversion line (Tenkan-sen) and the base line (Kijun-sen) can signal potential trend changes, allowing traders to make informed decisions about their positions.
The Chikou Span, or lagging line, offers further confirmation of price momentum by plotting past price action in relation to current price levels. This can help traders assess whether the current trend has strength or may be losing momentum.
Moreover, when the Senkou Span A crosses above the Senkou Span B, it can indicate a bullish shift in market sentiment, while a cross below may suggest bearish tendencies. Overall, the Ichimoku Cloud provides a comprehensive view of various market factors that can aid crypto traders in making more accurate trading decisions on TradingView.
- Utilizes multiple components for a comprehensive view
- Visually represents support/resistance levels and trend changes
- Offers confirmation of price momentum
- Provides signals for bullish/bearish shifts in market sentiment
Conclusion
In conclusion, utilizing free indicators on TradingView for crypto trading is crucial for making informed trading decisions. The plethora of available indicators allows traders to analyze market trends, identify potential entry and exit points, and ultimately increase the probability of profitable trades. From moving averages to Bollinger Bands, Relative Strength Index (RSI), MACD, Volume Profile, and Ichimoku Cloud, there are various free indicators that can provide valuable insights into the crypto market.
Among the best free indicators on TradingView for crypto trading, the Moving Average Convergence Divergence (MACD) stands out for its ability to signal changes in the strength of a trend. Additionally, Bollinger Bands are highly effective in identifying overbought or oversold conditions in the market. Furthermore, traders can benefit from using Volume Profile to analyze price movements and identify key support and resistance levels.
It is important for traders to explore and experiment with different free indicators to find the ones that best suit their trading style and preferences. Ultimately, incorporating these indicators into one’s trading strategy can lead to more informed decision-making and potentially improved profitability in the volatile world of cryptocurrency trading.


